I am pleased to post (for the first time) screen shots of our Membrane Computing Agent Base Model. In this post i am focusing on interface mostly. Beside the fact that we want to have an accurate model, we also want a model that is easy to use. So we thought about design issues with our interface. How can we (computer scientists) hide as much code as possible so when a biologist uses our software, they don't freak out.
So lets take a look at our main screen:

If the size of the picture is small and you have a hard time making out the details, you can always click on the photo and see a full size version. Unfortunately this is the largest size that the blog allows for posting images online. Anyways going back to our interface, on the top you see "Quorum Sensing Model - Version 2.0". So this is our QS model and the version 2.0 is our latest release. We initially started with version 1.0 and gone through 1.1, 1.2, 1.3, ... , 1.7. With versions 1.x we were adding basic functionality to the system. Simply setting up a framework, introducing rules, figuring out how to define rules and so on. In version 2.0 we have build the interface on top of our framework so users can interact with the system without the need of knowing how the code works. You don't need to compile anything, or type a single line of code. This is the beautify of Mathematica. I don't want to get into Mathematica and our implementation; however I want to mentioned that all you need to know to run our program is a shift+enter and that will do the trick. We have also worked on improving run-time speed of our simulation and I am happy to say that version 2.0 is about 5x faster than version 1.0!
Going back to our interface, there are three different tabs on the top: Input, Visualization and About. Input tap includes 2 sub-tabs: Simulation parameters and Rule Constants. Under simulation parameters, we have different parameters to set before running the simulation. To get the user started, each parameter is set to a default value. User is able to modify each value before running the program. We will go over each parameter on our next post. For now lets focus on interface. We have different parameters for the simulation in general (population size and simulation step). Cytoplasm, Periplasmic space and environment also get their own list of parameters. At bottom of the interface we have a check box which allows user to introduce division into the mix. So there are two different way of running the simulation. When division check box is not selected, starting with 20 individual cells, the simulation ends with 20 cells and outputs a set of results. However when division checkbox is selected, user might start with 20 cells and based on how many steps is specified by the user, the system might end up with 40 or 80 cells. Results of the simulation also reflect the division. Next blow the checkbox we have a button for running the simulation and then the current status of simulation is shown below ("Ready!"). In order to give user an idea about current status of the simulation we have added a progress bar which only appears when the program is running. This progress bar gives the user a status update on how long will the simulation take before completion. Here is a screenshot of a simulation in progress:

In this example the simulation is 69% completed. Next is looking at rule constants. Each rule in our simulation has a constant associated with it. This constant is used for calculating probability of a reaction. The system is loaded with default values for each constant. However one can modify each value before running the simualtion. Here is an screen shot of rule constants:
 Because it is hard to remember which constant belongs to which rule, we have enabled a tool-tip option so when a user moves the mouse pointer over each constant, its corresponding interaction rule is displayed (as shown above). This should help out the user in associating each constant value with an interaction rule in the system.
 We are going to skip visualization section for now (still under development). Lets go to About tab.


Here under about tab we plan to include copy rights, information about developers and other related information. There is also another aspect of our modeling project which is on hold for now due to time constraints. That is, ability of exporting results. Lets take a look at what we are planning to have maybe by end of this year:
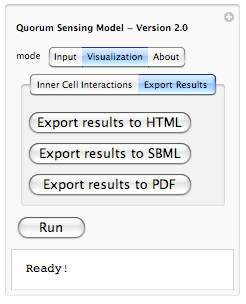 Yes, we are planning to integrate the ability of exporting results from the simulation to HTML (for posting online), SBML (Systems Biology Markup Language - for visualizing metabolic pathways and importing to popular biological modeling tools such as Cell Designer) and PDF (for sharing as well as printing). This is part of our future work for expanding the model and making it even more useful.
 Yes, we are planning to integrate the ability of exporting results from the simulation to HTML (for posting online), SBML (Systems Biology Markup Language - for visualizing metabolic pathways and importing to popular biological modeling tools such as Cell Designer) and PDF (for sharing as well as printing). This is part of our future work for expanding the model and making it even more useful.
If you have been wondering about results, well our model is also able to produce nice and clean graph visualizations. Lets take a look at sample AI2 concentration over 1000 steps:
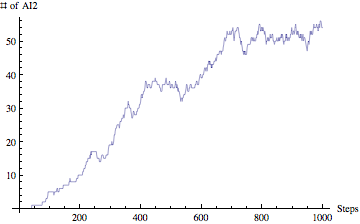

I am gong to present only this graph for our result section just to demonstrate that our model is able to not only simulate by also analyze the results and visualize them.
Ok. This should do it for now. Consider this post as a sneak preview of what hopefully will be a complete Quorum Sensing Model. We hope to have our completed model posted on UCalgary wiki by end of september.
Thanks for following our progress!
Afshin


No comments:
Post a Comment